|
|

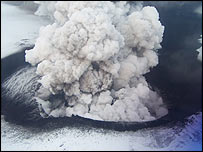
The eruption also released some sulphur dioxide (SO2) into the atmosphere, and this was measured by the SCIAMACHY instrument. Early 2005, when the SO2 data service was started with some preliminary test and maps, the SCIAMACHY data showed SO2 first north of Iceland and then travelling across Europe. In the initial setup of the service, the SO2 slant column value was used for alerts of SO2 events, and the SO2 detected on 2 Nov. 2004 satisfied those criteria, but only just. Since that time, the SO2 data service has been reconstructed and improved on several points: improved background corrections to minimisize false SO2 detections, the use of total SO2 column (instead of the slant column), etc. With these changes, the SO2 values on 2 Nov. 2004 are just below the alert criteria. The data sets found in the current (version 1.1) SO2 data archive are furthermore based on reprocessed SCIAMACHY measurement data, and with this new input data sets some SCIAMACHY orbits are unfortunately missing from the data archive -- no idea why -- and this is also the case for the orbit with the SO2 peak just north of Iceland seen first on 02 Nov. 2004, as can be see on this page in the data archive: the orbit crossing Iceland is not there. This makes it unfortunately impossible to recreate the SO2 maps in the new format, with the current colour scale. Our sincere apologies for this! Still, the event showed an interesting motion of the SO2 across Europe, and therefore we decided to give here access to the old web pages describing the event, where "old" means based on a previous version of the data and using the previous colour bar for the maps. |