Presentation and delivery of the data
The SO2 column values, usually given in
Dobson Units (DU), are presented and delivered
via the website in the form of images (maps) and data files.
Note that for OMI the NRT data files are not available; off-line OMI data
is available via the NASA website and KNMI.
There is no real difference between the Volcanic SO2 and the Air Quality SO2
Service, other than that they focus on different geographic regions. For
each of the regions and for the world as a whole images are provided for the
different data products. The data files always contain the data for the
whole world. In all cases data is presented for solar zenith angles (SZAs)
up to 85 degrees. Data of OMI is not limited in SZA.
This page gives an overview of the ways the data can be accessed
and what is presented there:
The following table lists for the different polar-orbiting nadir-viewing
satellite instruments measuring SO2 the normal swath width of the
instruments and the size of their normal ground pixels within that swath.
| instrument |
satellite |
swath
width |
ground
pixel size |
| SCIAMACHY |
ENVISAT |
960 km |
60 x 40 km |
| OMI |
EOS-AURA |
2600 km |
12 x 24 km |
| GOME-2 |
MetOp-A |
1920 km |
80 x 40 km |
The orbits of SCIAMACHY achieve global coverage at the equator in four days.
Due to its wide swath with OMI achieves global coverage in one day.
The swaths of GOME-2 are just a little too small for complete global
coverage at the equator in one day, but the gaps between successive orbits
are small.
Daily data at orbit coordinates

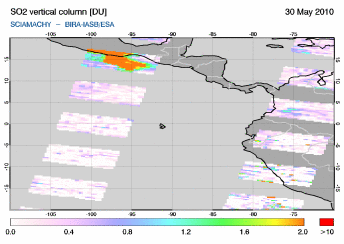
This presents the SO2 data at the coordinates of the measurements of the
satellite instruments (Guatemala, Pacaya volcano eruption). Note that at high latitudes the scans of successive
orbits will overlap one another, where the most recent data is plotted on
top.
In pictures based on data from scanning instruments (SCIAMACHY and GOME-2)
only the forward scan pixels are shown; backward scan pixels are not shown
to prevent overlapping. In OMI pictures all data is shown, since OMI is an
imaging rather than a scanning instrument.
In SCIAMACHY pictures, at the begin and end of each nadir state the
measurement time is shown. In GOME-2 and OMI pictures the measurement time of a given
swath is printed in the middle of the swath. Times are always in UTC. Note
that the time is not printed for states with latitudes above ±65
degrees, as orbits overlap one another there. For the Volcanic SO2 Service,
the extent of the geographic region is indicated by a thick black line.
The Archive Service provides images of the SO2
vertical (total) column and the slant column, the Absorbing Aerosol Index and the
cloud fraction.
Each orbit has its own ASCII data file; for a given day these ASCII data
files are grouped in a zip-file.
Daily data at grid coordinates

This presents the SO2 data gridded to a latitude-longitude grid of 0.25 by
0.25 degrees (which is about 25 km at the equator). Thsi picture show the Guatemala (Pacaya volcano eruption). For each grid cell the average of all measurement crossing that grid cell (i.e. using both forward
and backward scans in case of scanning instruments) is computed, using all
orbit files for the given day. The result is written to one HDF data file
per day.
The Archive Service provides such images for the SO2 vertical (total)
column and vertical column (if available), and where possible the
cloud fraction.
The Near-real time Service does not provide this type of data.
NOTE: it is not yet certain whether this time of data/images is going
to be provided also for OMI and GOME-2 derived date.
-->
-->
Monthly average data at grid coordinates

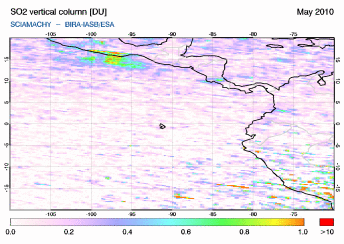
This presents the SO2 data gridded to a latitude-longitude grid of 0.25 by
0.25 degrees (Guatemala, Pacaya volcano eruption). For each grid cell the average of all measurement crossing
that grid cell (using forward and backward scans) is computed, using all
orbit files for the given month. The result is written to one HDF data file.
The Archive Service provides data and images for the SO2
vertical (total) column and the slant column.
Note that a montly average of the cloud fraction is not made: there is
no cloud screening method applied to the SO2 data, so that a monthly
average cloud fraction does not provide any useful additional information.
|