Move the cursor, click on the notification to see the image.
To see SACS notification images, the recommended browser is Mozilla Firefox
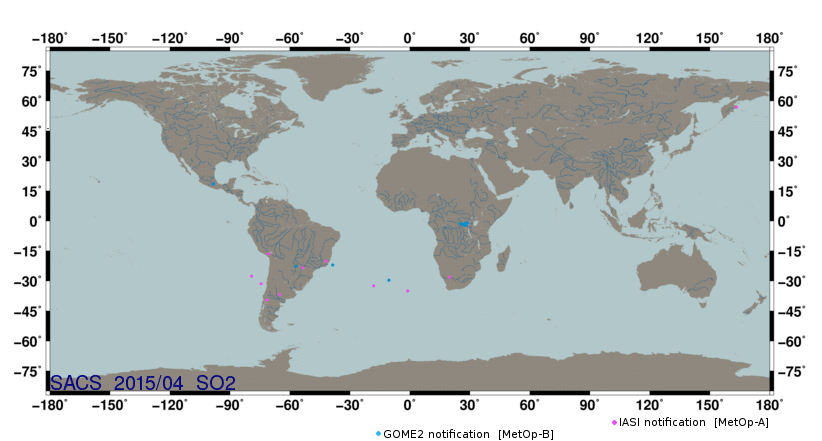
List of notifications for this setting
 period      time    long.   lat.    SO2  instrument  SZA   link plot
======================================================================
2015/04/03   16:28   -98.5   18.4    2.5    GOME2b    34.3   region 203
2015/04/07   16:45   -98.2   18.6    5.7    GOME2b    29.8   region 203
2015/04/08   13:59   -70.6  -16.4    4.0     IASIa    47.3   region 404
2015/04/09   07:42    26.6   -1.7    3.2    GOME2b    39.0   region 307
2015/04/10   07:22    28.3   -1.5    2.8    GOME2b    42.1   region 307
2015/04/13   08:00    27.2   -2.2    3.7    GOME2b    35.0   region 307
2015/04/13   23:42   163.4   56.9    3.4     IASIa    50.2   region 111
2015/04/15   07:18    28.3   -2.1    4.4    GOME2b    43.1   region 307
2015/04/18   07:56    25.4   -1.3    2.7    GOME2b    37.3   region 307
2015/04/19   07:35    27.7   -1.3    4.6    GOME2b    39.8   region 307
2015/04/20   07:15    27.8   -1.6    2.1    GOME2b    44.2   region 307
2015/04/23   02:34   -71.3  -39.5   58.8     IASIa   141.1   region 404
2015/04/24   02:13   -65.2  -36.7   54.8     IASIa   143.6   region 404
2015/04/24   15:11   -79.2  -27.6    3.7     IASIa    50.5   region 403
2015/04/25   03:34   -74.4  -31.4    4.9     IASIa   154.3   region 404
2015/04/25   23:50   -18.1  -32.4    3.2     IASIa   153.9   region 405
2015/04/26   12:00   -38.6  -22.0   21.9    GOME2b    51.6   region 405
2015/04/27   01:14   -53.5  -23.4    6.5     IASIa   146.5   region 404
2015/04/27   13:20   -56.8  -22.6    8.2    GOME2b    51.0   region 404
2015/04/28   07:49    28.7   -0.9    9.9    GOME2b    36.5   region 307
2015/04/28   21:07    19.8  -28.1    4.4     IASIa   155.0   region 407
2015/04/29   09:18   -10.5  -29.6    7.8    GOME2b    65.0   region 406
2015/04/29   22:26    -1.1  -35.0    3.1     IASIa   150.7   region 406
2015/04/30   11:23   -41.8  -20.1    4.8     IASIa    60.6   region 405
|
Note that SO2 measurements are in DU for UV-visible and thermal IR instruments (vertical column density)
and in K for IASI instrument for year 2013 and following (brightness temperature difference).
Back
|


