Move the cursor, click on the notification to see the image.
To see SACS notification images, the recommended browser is Mozilla Firefox
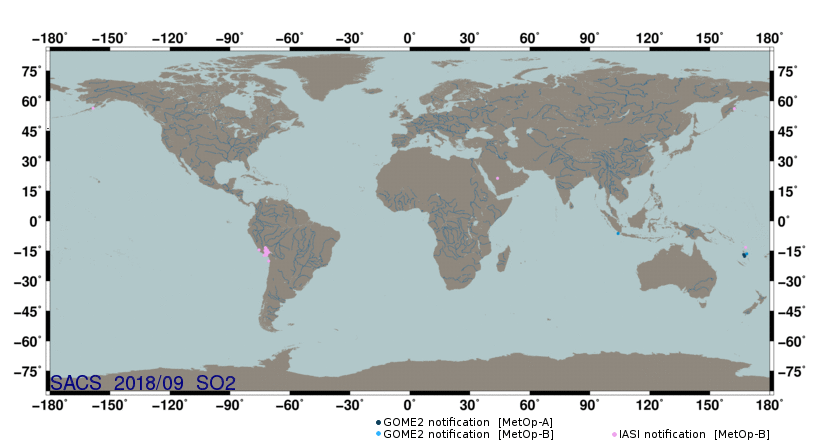
List of notifications for this setting
 period      time    long.   lat.    SO2  instrument  SZA   link plot
======================================================================
2018/09/01   02:03   -71.4  -16.3    3.4     IASIb   139.5   region 404
2018/09/01   21:37   168.0  -13.2    2.0     IASIb    51.7   region 312
2018/09/02   21:56   167.5  -17.1    2.1    GOME2a    49.3   region 412
2018/09/04   02:41   -72.1  -16.1    7.2     IASIb   147.8   region 404
2018/09/06   01:59   -71.6  -17.1    2.9     IASIb   138.1   region 404
2018/09/06   21:34   168.5  -16.4    2.1    GOME2b    51.4   region 412
2018/09/07   14:27   -71.6  -15.7    3.6     IASIb    40.1   region 404
2018/09/08   02:58   -71.8  -16.6    4.3     IASIb   151.5   region 404
2018/09/10   23:12   162.3   56.1    2.4     IASIb    56.4   region 111
2018/09/11   14:44   -71.8  -15.3    2.7     IASIb    35.3   region 404
2018/09/13   14:03   -71.2  -14.6    3.0     IASIb    43.1   region 304
2018/09/14   13:42   -71.8  -15.8   13.3     IASIb    48.3   region 404
2018/09/16   02:49   104.1   -6.3    3.4    GOME2b    34.1   region 309
2018/09/16   22:06   167.4  -17.7    3.6    GOME2a    44.0   region 412
2018/09/17   14:20   -70.6  -15.7    4.5     IASIb    38.0   region 404
2018/09/18   13:59   -72.0  -14.9    4.4     IASIb    43.4   region 304
2018/09/20   02:10   -72.3  -13.4    2.5     IASIb   140.4   region 304
2018/09/21   14:37   -75.4  -14.5    2.1     IASIb    37.0   region 303
2018/09/23   02:47   -72.9  -17.3    3.6     IASIb   146.3   region 404
2018/09/24   02:27   -71.8  -15.7   12.7     IASIb   143.5   region 404
2018/09/25   02:05   -70.6  -20.1    3.5     IASIb   137.8   region 404
2018/09/25   21:20  -158.4   56.4    2.2     IASIb    59.2   region 101
2018/09/27   14:13   -72.5  -14.8    3.8     IASIb    38.6   region 304
2018/09/28   18:07    43.9   21.3    2.0     IASIb   135.3   region 207
2018/09/30   02:04   -72.0  -13.6    2.5     IASIb   138.3   region 304
2018/09/30   22:16   167.0  -16.8    2.3    GOME2a    38.5   region 412
|
Note that SO2 measurements are in DU for UV-visible and thermal IR instruments (vertical column density)
and in K for IASI instrument for year 2013 and following (brightness temperature difference).
Back
|


