Move the cursor, click on the notification to see the image.
To see SACS notification images, the recommended browser is Mozilla Firefox
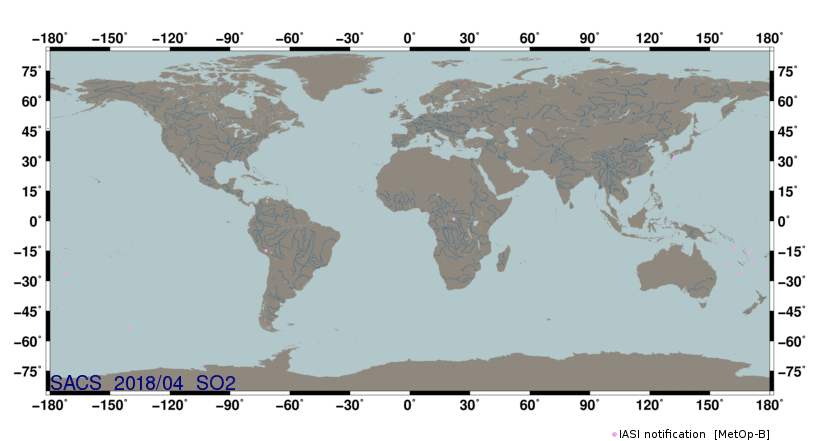
List of notifications for this setting
 period      time    long.   lat.    SO2  instrument  SZA   link plot
======================================================================
2018/04/01   14:19   -72.0  -14.8    3.3     IASIb    42.7   region 304
2018/04/05   00:52   132.1   31.4    5.5     IASIb    41.3   region 210
2018/04/05   23:02   162.6  -13.9   18.3     IASIb    38.0   region 311
2018/04/06   11:32   159.6  -22.0    3.6     IASIb   149.3   region 411
2018/04/07   11:10   165.0  -26.3    3.5     IASIb   147.4   region 412
2018/04/08   09:09   178.6  -25.4    3.3     IASIb   134.2   region 412
2018/04/08   22:02   172.4  -21.2    4.9     IASIb    46.7   region 412
2018/04/10   20:23    21.9    0.9    2.9     IASIb   146.3   region 307
2018/04/11   09:50   169.7  -15.5    3.3     IASIb   137.6   region 412
2018/04/12   09:26  -172.2  -25.8    4.7     IASIb   146.3   region 412
2018/04/13   09:07  -175.1  -17.6    3.1     IASIb   142.1   region 412
2018/04/14   06:55  -140.2  -53.0    3.2     IASIb   127.9   region 501
|
Note that SO2 measurements are in DU for UV-visible and thermal IR instruments (vertical column density)
and in K for IASI instrument for year 2013 and following (brightness temperature difference).
Back
|


