Move the cursor, click on the notification to see the image.
To see SACS notification images, the recommended browser is Mozilla Firefox
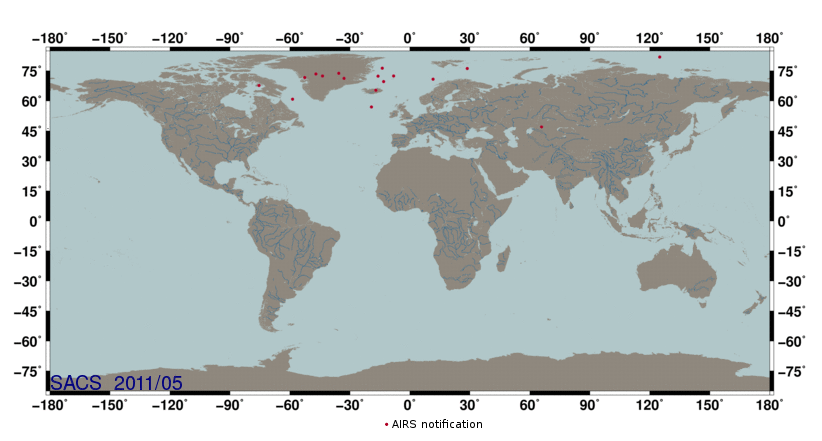
List of notifications for this setting
 period      time    long.   lat.    SO2  instrument  SZA   link plot
======================================================================
2011/05/22   03:37   -17.0   65.4   65.5      AIRS    89.5   region 105
2011/05/23   02:40   -15.9   72.4   33.3      AIRS    85.5   region 105
2011/05/23   15:41   -32.9   71.3   93.7      AIRS    52.5   region 105
2011/05/24   04:58    28.7   76.2   20.9      AIRS    66.6   region 001
2011/05/24   18:02   -75.4   67.7   68.7      AIRS    48.0   region 103
2011/05/25   07:22   -35.6   73.8   12.1      AIRS    73.8   region 105
2011/05/25   22:21    65.9   47.0   19.1      AIRS   102.2   region 108
2011/05/26   12:57   -52.6   71.7   29.3      AIRS    54.9   region 104
2011/05/27   03:54   -13.1   69.7   15.8      AIRS    83.3   region 106
2011/05/27   16:52   -58.7   60.9   18.0      AIRS    41.0   region 104
2011/05/28   06:14    -8.1   72.5   10.5      AIRS    70.8   region 106
2011/05/28   19:24   125.0   82.0    6.8      AIRS    73.0   region 001
2011/05/29   08:36   -43.7   72.5    8.6      AIRS    70.6   region 105
2011/05/30   01:08    11.6   70.9   18.9      AIRS    85.2   region 106
2011/05/30   14:04   -19.2   57.0    9.1      AIRS    36.5   region 105
2011/05/31   03:28   -13.8   76.4   28.9      AIRS    78.9   region 001
2011/05/31   16:31   -47.0   73.5   16.8      AIRS    52.9   region 104
|
Note that SO2 measurements are in DU for UV-visible and thermal IR instruments (vertical column density)
and in K for IASI instrument for year 2013 and following (brightness temperature difference).
Back
|


