Move the cursor, click on the notification to see the image.
To see SACS notification images, the recommended browser is Mozilla Firefox
List of notifications for this setting
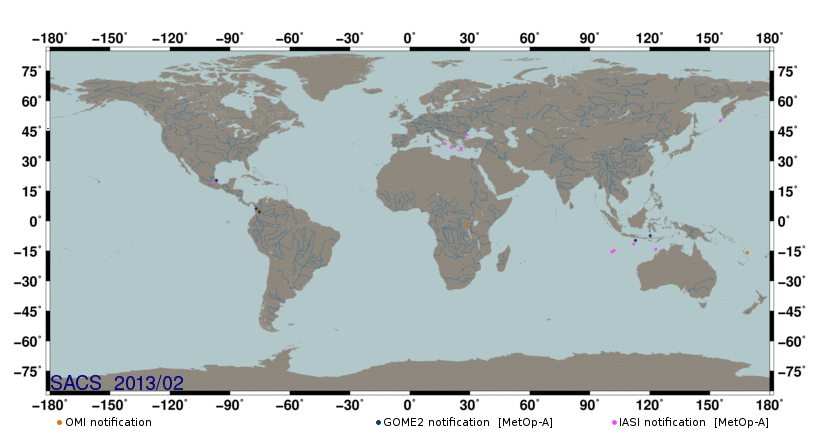
 period      time    long.   lat.    SO2  instrument  SZA   link plot
======================================================================
2013/02/02   11:41    28.7   -1.7    8.6       OMI    25.3   region 307
2013/02/03   00:53   120.2   -7.4   11.8    GOME2a    48.8   region 310
2013/02/03   13:26   122.9  -14.2    3.5     IASIa   131.0   region 310
2013/02/04   02:13   112.9   -9.7    5.3    GOME2a    37.4   region 310
2013/02/04   14:47   112.0  -11.5    3.4     IASIa   139.8   region 310
2013/02/05   14:26   102.2  -14.8    3.3     IASIa   126.4   region 309
2013/02/06   03:14   101.1  -15.5    3.4     IASIa    32.6   region 409
2013/02/07   18:37   -76.0    4.0    4.2       OMI    27.3   region 303
2013/02/11   14:54   -75.3    4.6    5.8    GOME2a    40.0   region 303
2013/02/12   03:42   -98.3   19.2    3.2     IASIa   135.2   region 203
2013/02/12   16:10   -96.7   20.2    2.8    GOME2a    50.0   region 203
2013/02/14   09:54   155.3   50.1    6.7     IASIa   118.9   region 111
2013/02/15   15:11   -76.9    6.1    2.5    GOME2a    37.8   region 303
2013/02/16   18:31   -76.3    4.5    4.2       OMI    24.5   region 303
2013/02/19   08:35    20.8   36.8   10.5     IASIa    57.3   region 207
2013/02/20   08:14    25.7   36.2    4.4     IASIa    56.7   region 207
2013/02/21   02:16   168.7  -15.8    3.4       OMI    19.5   region 412
2013/02/23   20:12    17.5   38.6   11.0     IASIa   131.9   region 207
2013/02/24   08:29    28.5   43.0    3.8     IASIa    57.7   region 207
|
Note that SO2 measurements are in DU for UV-visible and thermal IR instruments (vertical column density)
and in K for IASI instrument for year 2013 and following (brightness temperature difference).
Back
|


