Move the cursor, click on the notification to see the image.
To see SACS notification images, the recommended browser is Mozilla Firefox
List of notifications for this setting
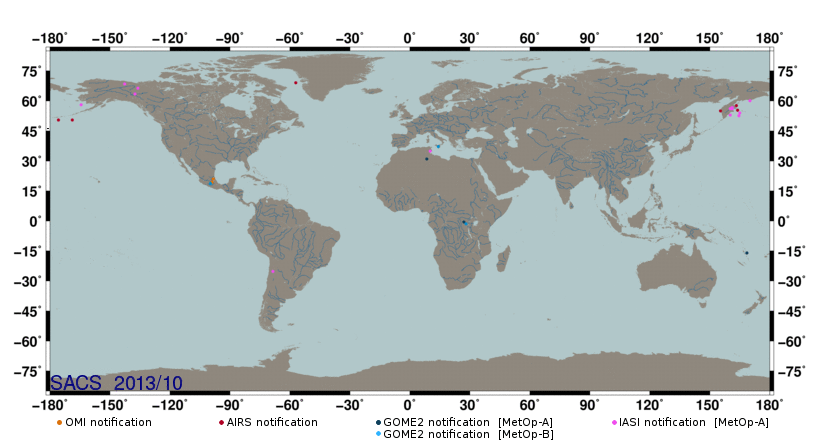
 period      time    long.   lat.    SO2  instrument  SZA   link plot
======================================================================
2013/10/02   19:49   -98.9   19.4    2.8       OMI    31.2   region 203
2013/10/03   16:44   -99.7   18.7    3.1    GOME2b    34.6   region 203
2013/10/04   08:02    28.1   -1.4    4.2    GOME2b    29.1   region 307
2013/10/05   22:04   168.6  -16.0    3.9    GOME2a    38.3   region 412
2013/10/09   19:55   -98.4   21.1    3.5       OMI    36.2   region 203
2013/10/12   07:43    27.0   -0.5    2.2    GOME2a    34.5   region 307
2013/10/13   10:10   161.2   56.7    3.1     IASIa   121.3   region 111
2013/10/13   23:59   161.4   56.2    3.9     IASIa    65.6   region 111
2013/10/14   23:39   160.3   52.9    4.4     IASIa    64.1   region 111
2013/10/15   14:41   163.3   57.7    9.3      AIRS   126.7   region 111
2013/10/16   09:08   160.2   56.1    6.8     IASIa   114.7   region 111
2013/10/17   00:35   170.1   60.1    3.0     IASIa    69.9   region 112
2013/10/17   16:08   155.4   55.0   14.8      AIRS   124.1   region 111
2013/10/18   10:05   164.6   52.6    6.6     IASIa   126.5   region 111
2013/10/18   22:16   165.0   54.0    7.4     IASIa    71.3   region 111
2013/10/19   12:39  -168.8   50.5    9.7      AIRS   134.8   region 112
2013/10/20   01:28  -175.8   50.5    8.1      AIRS    66.3   region 112
2013/10/20   14:55   163.9   55.4   20.2      AIRS   128.8   region 111
2013/10/21   04:03  -137.5   63.5    3.2     IASIa   107.6   region 101
2013/10/21   19:27  -142.7   68.5    3.1     IASIa    81.9   region 101
2013/10/22   08:43  -164.4   58.1    3.4     IASIa   128.3   region 101
2013/10/22   20:47  -136.1   66.4    3.4     IASIa    77.9   region 101
2013/10/25   07:00   -57.1   69.1    4.2      AIRS   114.3   region 104
2013/10/26   08:37    14.2   37.2    9.8    GOME2b    57.9   region 206
2013/10/26   20:43    10.2   34.9    8.0     IASIa   141.6   region 206
2013/10/27   09:05     8.5   31.0    2.1    GOME2a    52.9   region 206
2013/10/29   13:43   -68.5  -25.2    4.0     IASIa    37.8   region 404
2013/10/30   09:18   161.0   56.1    3.2     IASIa   120.8   region 111
|
Note that SO2 measurements are in DU for UV-visible and thermal IR instruments (vertical column density)
and in K for IASI instrument for year 2013 and following (brightness temperature difference).
Back
|


