| |
South Atlantic Anomaly
The Van Allen radiation belts are doughnut-shaped regions of high-energy
charged particles trapped by the earth's magnetic field. The inner radiation
belt, discovered by James Van Allen in 1958 with the Explorer 1 and 3
missions of NASA, occupies a relatively compact region above the equator
roughly between 40 degrees north and south.
The earth's magnetic dipole field is offset from its centre by about 500 km.
As a result of this, the inner Van Allen belt is on one side closer to the
earth's surface. This region is named the South Atlantic Anomaly (SAA) and
it covers a part of South America and the southern Atlantic Ocean: it lies
roughly between latitudes 5 and 40 degrees South, and between longitudes
0 and 80 degrees West -- the precise strength, shape and size of the
SAA varies with the seasons.
This dip in the earth's magnetic field allows charged particles and cosmic
rays to reach lower into the atmosphere. Low-orbiting satellites, such as
ERS-2 and ENVISAT, pass daily through the inner radiation belt in the
SAA-region. Upon passing the inner belt, charged particles may impact on the
detector, causing higher-than-normal radiance values, which in turn
decreases the quality of the measurements (i.e. the signal-to-noise
ration, of earthshine spectra), notably in the UV.
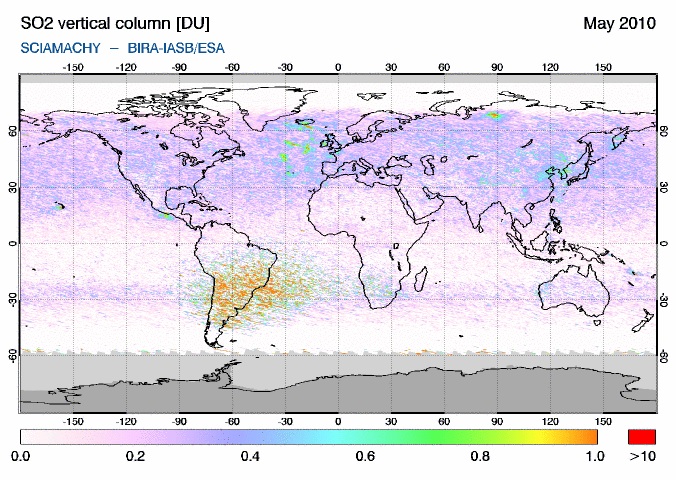
This reduction of the signal-to-noise also affects the retrievals of SO2
slant and vertical columns: in the SAA region the variations in slant and vertical column values are
much higher than elsewhere. This shows up clearly, for example, in the
monthly average, as the image below illustrates. The decreased
signal-to-noise may result in artifacts in the SO2 vertical columns.

|
|
The monthly average SO2 vertical column for May 2010. Note the increased
noise in the SO2 vertical column over South America and a part of the Southern
Atlantic Ocean, which can be attributed to the South Atlantic Anomaly.
|
SO2 data derived from OMI measurement seem to be affected less by the
SAA than GOME-2 and SCIAMACHY. Probably this is because of the way the
SO2 is computed: as a kind of "by-product" of the ozone retrieval, and
the ozone retrieval is less sensitive to the SAA due to the strong
ozone absorption signals in the measurements.
Another difference is that SCIAMACHY and GOME-2 are scanning instruments
whereas OMI is an imaging instrument.
A scanning instrument observes the individual ground pixels along an
east-west swath one at a time and for each of these pixels charged
particles will hit the detector in a different place and affect the
measurements differently for each ground pixel.
An imaging instrument sees an entire swath width in one go and there
the detector is hit in several places by charged particles, affecting
only a few ground pixels.


|
|
Example of SO2 vertical column data based on SCIAMACHY (top), GOME-2 (centre) and OMI
(bottom) data on 2 January 2008. The SO2 plume is related to the
eruption of the Llaima volcano (Chile), marked by a blue triangle in plots,
on 1 January. The top and centre plots show a lot of noise in the SO2 signal due
to the interference caused by the SAA; on the bottom the OMI data is clearly much less affected.
|
Because of these artifacts in the SO2 data, neither the Volcanic SO2 nor the
Air Quality SO2 Service has a geographic region defined in the area of the
South Atlantic Anomaly for which plots are made and shown on the website. To
benefit the analysis and to help avoid issuing false notifications of an
exceptional SO2 concentration due to the SAA, a "dummy region" of 40 by 40
degrees, centred around (-45.0,-25.0), is defined and monitored hidden from
data users. This "SAA-region" overlaps with regions "Northern Chile" and
"Central Chile" of the Volcanic SO2 Service. As the following picture show,
the "SAA-region" covers only the central part of the SAA, but for the moment
this seems good enough.
|
|