| |
Slant Column and Vertical Column Densities
Nadir-viewing satellite based instruments, such as SCIAMACHY and GOME-2,
measure the sunlight scattered in the atmosphere and reflected by the
surface of the Earth, as function of the wavelength of the light. In other
words: the instruments measure earthshine spectra. Comparing such a
spectrum with the spectrum of the sunlight itself provides information on
the distribution and concentration of trace gases, such as ozone and SO2,
because these gases absorb or scatter part of the incoming sunlight
(instead of using the solar spectrum for this comparison, one can also use
an earthshine spectrum from a part of the atmosphere free of the trace
gases under study).
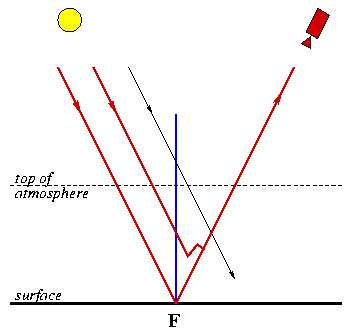
Cloud free case

Schematic representation of the slant path (thick red lines) of incoming
sunlight through the earth's atmosphere to the satellite, associated with the
footpoint F (the point on the earth's surface the
satellite is looking at). A part of the light reaching the satellite is
reflected by the earth's surface, another part is scattered higher in the
atmosphere. The thick blue line represents the "vertical column" at
footpoint F.
The above graph shows schematically the paths of sunlight reaching the
satellite through the atmosphere, reflected by the earth's surface and
scattered in the atmosphere. As the light follows these paths, some of the
photons are absorbed by the trace gases in the atmosphere. The spectrum of
the light measured by the satellite (the sum, as it where, of the thick red
lines in the graph) thus provides information on the trace gases along
the entire light path. In other words, the total density of a given gas,
such as SO2, is the concentration of this gas along the entire path. This is
usually called the slant column density (SCD) associated with
footpoint F, the point on the earth's surface the satellite is
looking at.
The SCD clearly does not provide the total concentration right above
footpoint F, i.e. along the blue line in the graph. The
total concentration along this line is called the vertical column
density (VCD). It is this VCD that provides the most useful and directly
interpretable information on the distribution and concentration of trace
gases. It is therefore desirable to convert the SCD into the VCD.
As can be seen from the graph above, the VCD (along the blue line) is
usually smaller than the SCD (along the red lines). The ratio between these
two column densities:
AMF = SCD / VCD
is called the Air-Mass Factor. The value of the AMF depends on the length of the light path, the vertical distribution of absorbing trace gases
in the atmosphere, the reflectivity (albedo) of the earth's surface, etc.
The length of the light path depends on the position of the Sun (expressed
in the Solar Zenith Angle, SZA) and the angle under which the satellite is looking at the atmosphere. The AMF can be pre-calculated for a variety of
these quantities or computed with a chemistry transport model, and applied
to the SCD to find the VCD at footpoint F.
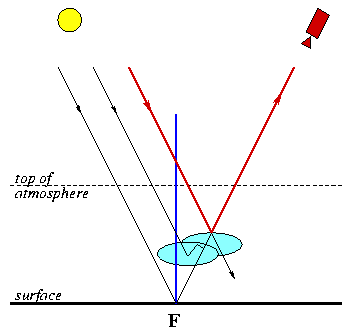
Partly clouded case

Schematic representation of the slant path (thick red lines) of incoming
sunlight through the earth's atmosphere to the satellite, associated with the
footpoint F (the point on the earth's surface the
satellite is looking at), in the presence of clouds. These clouds partly
shield the satellite's view of the atmosphere above
footpoint F.
If there are clouds in the atmosphere, things become more complicated.
Clouds namely reflect (and scatter) incoming sunlight and thus effectively
shield all that is going on below the clouds from the satellite's view.
Clearly, the satellite measurements provide an SCD which contains only
information on the atmosphere above the clouds. To find the real VCD
at footpoint F in such situations, an "effective" AMF is
computed, taking the cloud fraction (which gives the percentage of the cloud
cover) into account. In the presence of clouds the VCD is clearly less
accurate than the VCD derived under clear-sky conditions.
There are two approaches possible to convert the SO2 slant column density,
retrieved with a DOAS technique, into a vertical column density. Both of
these approaches use an air-mass factor (AMF), and they are described
elsewhere in these pages:
|
|