Move the cursor, click on the notification to see the image.
To see SACS notification images, the recommended browser is Mozilla Firefox
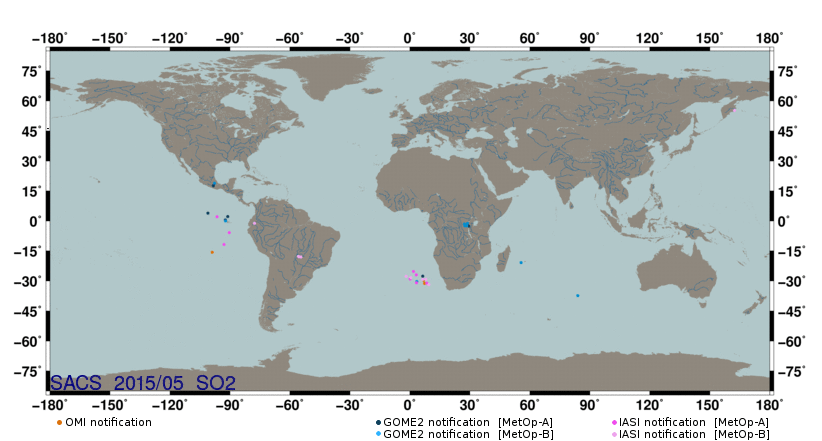
List of notifications for this setting
 period      time    long.   lat.    SO2  instrument  SZA   link plot
======================================================================
2015/05/01   00:47   -55.5  -17.9    3.5     IASIb   138.9   region 404
2015/05/01   13:36   -54.5  -18.0    3.2     IASIb    44.4   region 404
2015/05/02   02:06   -55.7  -17.7    3.3     IASIb   157.6   region 404
2015/05/02   16:28   -97.7   18.9    5.7    GOME2b    29.0   region 203
2015/05/03   07:46    28.8   -1.3    3.3    GOME2b    37.7   region 307
2015/05/03   21:05     0.1  -29.0    6.6     IASIa   138.7   region 406
2015/05/04   09:14     3.5  -30.3    4.4    GOME2b    58.6   region 406
2015/05/04   21:38     6.4  -29.3    4.0     IASIb   151.0   region 406
2015/05/05   09:40     3.3  -30.9    3.6     IASIa    55.9   region 406
2015/05/05   22:02     8.5  -31.1    3.5     IASIa   156.8   region 406
2015/05/06   13:19     6.9  -29.7    2.4       OMI    53.4   region 406
2015/05/07   08:03    27.3   -1.5    4.0    GOME2b    36.0   region 307
2015/05/07   20:35     8.0  -29.2    3.7     IASIb   139.6   region 406
2015/05/08   08:37     6.4  -27.6   11.7    GOME2a    61.2   region 406
2015/05/08   21:02     3.2  -26.9    3.9     IASIa   141.7   region 406
2015/05/09   10:09   162.4   55.2    2.9     IASIb    98.0   region 111
2015/05/09   22:22     1.8  -25.2    3.7     IASIa   158.4   region 406
2015/05/10   21:14    -1.9  -27.7    3.1     IASIb   140.1   region 406
2015/05/11   22:33     0.4  -28.4    3.8     IASIb   158.8   region 406
2015/05/12   14:20     7.4  -31.2    2.2       OMI    64.6   region 406
2015/05/13   07:48     9.5  -31.8    3.4     IASIb    71.2   region 406
2015/05/16   03:23    84.0  -37.3    2.3    GOME2b    70.0   region 409
2015/05/18   05:59    55.6  -20.8    3.1    GOME2b    52.3   region 408
2015/05/19   07:15    27.7   -2.4    3.3    GOME2b    46.8   region 307
2015/05/21   08:13    27.4   -2.4    2.5    GOME2b    36.2   region 307
2015/05/23   07:32    28.4   -2.4    2.0    GOME2b    43.4   region 307
2015/05/24   16:19   -98.3   17.6    3.5    GOME2a    31.1   region 203
2015/05/25   07:37    29.4   -2.5    5.8    GOME2a    42.0   region 307
2015/05/26   03:01   -90.3   -5.8   33.2     IASIa   134.6   region 303
2015/05/26   15:41   -91.1    2.2    8.8    GOME2a    39.0   region 303
2015/05/27   04:19   -93.0  -11.8    7.1     IASIa   151.9   region 303
2015/05/27   20:17   -98.9  -15.7    2.4       OMI    45.1   region 403
2015/05/28   14:14   -77.7   -1.2    3.4     IASIb    48.1   region 303
2015/05/29   03:41   -96.4    2.1    3.3     IASIa   134.0   region 303
2015/05/29   16:19  -101.0    3.9    6.2    GOME2a    38.7   region 303
2015/05/30   15:13   -92.2   -0.0    9.2    GOME2b    46.9   region 303
2015/05/31   15:38   -92.3    0.5    3.6    GOME2a    41.9   region 303
|
Note that SO2 measurements are in DU for UV-visible and thermal IR instruments (vertical column density)
and in K for IASI instrument for year 2013 and following (brightness temperature difference).
Back
|


